Inflation Falls as M2 Hints of Deflation

Inflation peaked at 9.1% in June and has been in a slide since (six months in a row).

Here’s the latest (Washington Examiner, Jan. 12):

Inflation drops to 6.5% in December as price pressures ease

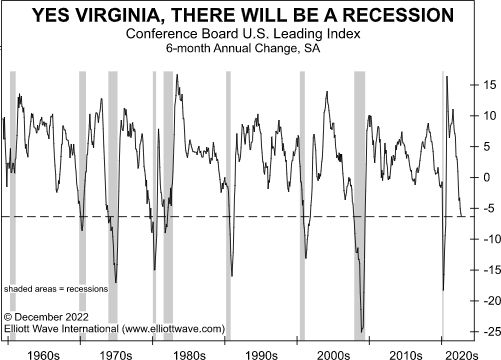
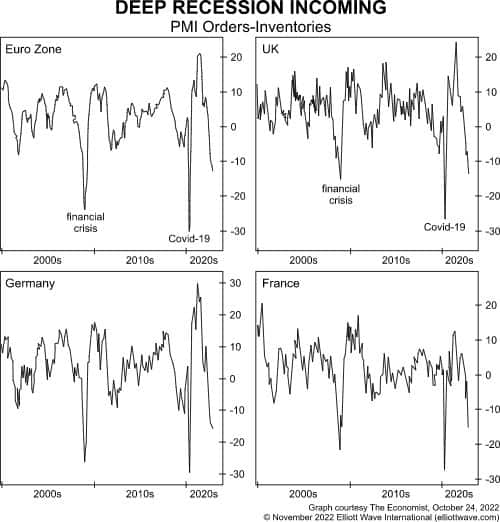
In the meantime, deflationary forces continue to gather steam.

This chart and commentary are from the December Elliott Wave Theorist:

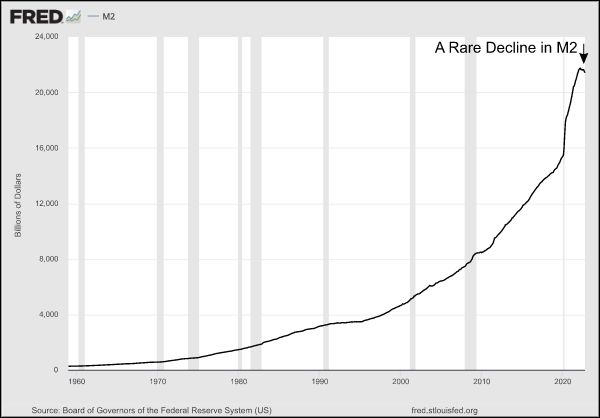
Quantitative tightening is rare, and it is happening. According to the St. Louis Fed, M2 is defined as follows:

“M2 is a measure of the U.S. money stock that includes M1 (currency and coins held by the non-bank public, checkable deposits, and travelers’ checks) plus savings deposits (including money market deposit accounts), small time deposits under $100,000, and shares in retail money market mutual funds.”

[The chart], published by the Fed, shows that absolute M2 has been declining on a month-by-month basis for the first time in many decades, probably since the 1930s or 1940s. This trend is deflationary. [emphasis added]

It is incredible that this trend has emerged. It took a historic, 13-year orgy of money-printing by the Fed from 2008 through 2021 to finance the final runup in the Great Asset Mania. There is no way it can be resuscitated under conditions of a flat M2, much less a shrinking M2.

U.S. Car Sales Hit Big Bump in the Road

Car salespeople across the country probably said “look at this beauty” about as many times in 2022 as they did the year before and the year before that.

Even so, here’s the bottom line (Wall Street Journal, Jan. 4):

U.S. Auto Sales in 2022 Worst in Over a Decade

Some of those who “flip” cars didn’t do so well either. Indeed, you might call it a crash.

Here’s a chart and commentary from the November Elliott Wave Financial Forecast:

The flipping fallout extends beyond the housing market. The chart shows what happened to flippers of the second-most valuable household asset, cars. Shares in Carvana Co., an online used car dealer that bought up hundreds of thousands of cars in the final months of the bull market, are now down 97% from an August 2021 peak. Most of Carvana’s purchases were financed with $3.2 billion in borrowed money. The company’s rise accompanied a boom in used car prices, but it didn’t take much in the way of a reversal to decimate Carvana’s valuation. The Manheim Used Vehicle Price Index peaked with the Dow Industrials in January. As we keep saying, the stock market decline is steadily working its way into the pores of the economy.

Carvana’s stock price is now even lower than it was when the November Elliott Wave Financial Forecast published.

Expect a Continued Deflation in Unicorn Company Funding

As you may know, a “unicorn” company is a term used in the venture capital industry to refer to a privately held startup with a value of over $1 billion.

There were a record number of them in 2021, but a big shift appears to be underway. Here’s a Dec. 21 news item from bizjournals.com:

Where did the unicorns go? $1B startups are getting harder to find

The pace of new $1 billion startups has “fallen precipitously in recent months” … and the trend is likely to continue

The headline and subhead line reflect what the Elliott Wave Financial Forecast said some three months ago. Here’s a chart and commentary from the October issue:

The first chart below shows the extent of unicorn funding from their inception in 1998 through the end of 2009, which included the bull market that topped in 2007. The total peaked at $277 million in 2008. The next chart shows what has happened since then. Record funding shot up to $281 billion in 2021, more than 1,000 times the 2008 peak! … In 2022, unicorns have raised $70 billion so far. … In the bear market, unicorns will go extinct, and it will last a very long time.

House Flipping Profits Rapidly Decline

House flippers are in it for fast profits.

Instead, the profits themselves have been falling fast.

Here’s a Dec. 15 CNBC headline:

Home flipping profits drop at the fastest pace in over a decade

As the article notes, in Q3, gross flipping profit fell 18.4% from the previous quarter.

The Elliott Wave Financial Forecast has been way ahead of this developing story. Back in September, the monthly publication showed this chart and said:

There are so many house flipping TV shows that FortuneBuilders.com, a house flipping website, issued a list of the “Top 10 House Flipping Shows to Watch in 2022.” Meanwhile, the big flippers have gotten hammered. In November, the Elliott Wave Financial Forecast showed what happened to Zillow’s stock after the company entered the flipping game last year and then had to quickly exit because of losses. The stock is now down 84% from its peak in February 2021. This chart shows what happened to the firm to which Zillow handed much of its flipping business. Opendoor Technologies, which The Wall Street Journal calls the market leader in automated home flipping, is down 89% from its peak, which also occurred in February 2021.

The September Elliott Wave Financial Forecast used data through Sept. 1. Then, Opendoor Technologies’ stock price was trading at $4.28. As of this writing intraday on Dec. 23, the price is even lower – way lower — $1.02!

Money Manager Reiterates Recession and Deflation Stance

You don’t have to skim the financial pages too long before running across a CEO, economist or fund manager who believes the U.S. is headed for a recession.

However, a well-known money manager just said that you don’t have to wait for a recession’s arrival. Here’s a quote from a Dec. 13 article from The Street:

Celebrity money manager Cathie Wood reiterated two of her most important views Dec. 13 – that we’re already in a recession and that we’re suffering from deflation. … The drop in commodity prices during recent months … represents a recessionary sign, Wood said.

A commodity that Wood specifically mentioned was crude oil.

Elliott Wave International’s Global Market Perspective called attention to the “deflationary” significance of crude oil’s price back in July – when the price was already down from a high:

Crude Oil futures made an intraday high on March 7 and a closing high on March 8. … The significant price declines since March 7-8 suggest a burgeoning slowdown in world economic activity and may mark a tipping point from inflationary pressures to deflationary ones. [emphasis added]

Here’s another sign of economic contraction from the December Global Market Perspective:

In October, existing home sales declined 28.4% year-over-year. As previously noted, another hallmark of the latest housing boom was record high purchases by non-occupants. According to Redfin, these so-called “investors” continue to abandon the market. In the third quarter, investor purchases of U.S. homes fell 30.2% from the third quarter of 2021. As we’ve discussed, home prices invariably follow the trend of sales, and that’s happening now. According to the National Association of Realtors, on the heels of slipping sales, the median price of an existing U.S. home fell 1.5% from September to October. As in the stock market, the leaders on the way up are now leading on the way down. According to S&P Case-Shiller, the biggest monthly declines as of August were in San Francisco (4.3%), Seattle (3.9%), San Diego (2.8%), Denver (2.3%) and Los Angeles (2.3%), all of which were red hot until the middle of 2022.

Insights into Britain’s “Austerity 2.0”

The phrase “era of austerity” is back in Britain (Nov. 15, CNBC):

British government to usher in new era of austerity in effort to restore market confidence

I say “back” because, as you may recall, the phrase was widely used during the early days of the 2007-2009 financial crisis. The re-introduction of “era of austerity” in the latter part of 2022 may be an omen of what’s ahead.

Indeed, many observers of Britain’s economy believe that a recession, and a prolonged one at that, is already in the cards (Dec. 8, The Times):

Investors pull £1bn from UK-focused funds ahead of recession

Elliott Wave International’s December Global Market Perspective mentioned Britain’s new era of austerity. The commentary is below this chart:

In November, finance minister Jeremy Hunt told the BBC, “We are going to see everyone paying more tax. We’re going to see spending cuts.” The idea is to plug the holes in the country’s finances and to restore public confidence, but, as in 2009, government policy is entirely dependent on the dominant social mood trend. According to this chart, authorities once again anticipate windfall inflows to the British Exchequer, but the most radical austerity measures won’t take effect until after the next general election in 2025. By then, stock prices should be much lower, and austerity will simply be an unavoidable part of everyday life.

Recession: The Handwriting is on the Wall

Who to believe – those who predict a recession or those who say a recession will be avoided?

A Bloomberg recession probability model prompted this headline back in mid-October (Bloomberg, Oct. 17):

Forecast for US Recession Within Year Hits 100% …

On the other hand, as we kick off the final month of the year, a different news item says otherwise (CNN, Dec. 1):

Inflation is cooling. Consumers are still spending. And hiring is slowing — but not collapsing. That’s why [a] chief economist … is increasingly confident that the American economy will — narrowly — escape a recession.

Well, in Elliott Wave International’s view, the handwriting is on the wall. Here’s a chart and commentary from the December Elliott Wave Financial Forecast:

An economic depression is closing in. The Elliott Wave Financial Forecast’s main reference point for this ongoing forecast is the stock market, which is the best leading indicator for the economy. There are other useful indicators. The Conference Board’s Leading Economic Index combines the trend of the S&P 500 with nine other economic variables. We’ve discussed some of these measures in recent issues, with updates on housing and credit conditions and the inverted yield curve in this issue. Other inputs include the ISM Index of New Orders, Average Weekly Manufacturing Hours and New Orders for Manufacturing and Consumer goods. As the chart shows, the Conference Board LEI has been plunging. In October, the six-month annual change dropped to minus 6.3. As the dashed line indicates, similar readings slightly preceded or accompanied all eight economic recessions since the 1960s. The first leading datapoint of November hit the wire yesterday morning. Last month, the ISM Manufacturing Index slid to 49 from 50.2. After falling for five of the past six months, the measure is now below 50, the threshold separating expansion from contraction. It is the first signal of contraction in this indicator since May 2020.

A “Precondition” for Deflation is Being Met

Robert Prechter’s Last Chance to Conquer the Crash says:

Deflation requires a precondition: a major societal buildup in the extension of credit and the simultaneous assumption of debt.

With that in mind, look at this Nov. 15 Bloomberg headline:

US Household Debt Jumps Most Since 2008 …

Specifically, households added $351 billion in debt in Q3 and this brings the total to $16.5 trillion, according to the Fed.

Don’t be surprised if delinquencies rise fast as the economy contracts.

The Elliott Wave Financial Forecast warned about this back in April 2019 – even before interest rates jumped.

In February [2019], EWFF described record-high U.S. household debt as a “pernicious” threat that will eventually wreak havoc with the U.S. economic order. Many of these borrowers are already coming up short. According to Bloomberg, U.S. student loan delinquencies hit a record high of $166 billion in the fourth quarter of 2018. The story is the same for auto loans. The Federal Reserve stated on February 12 [2019] that a record 7 million Americans were 90 days or more behind on auto loan payments. … Delinquency rates as a percentage of total outstanding balances are also significant. Student loan delinquency rates are at the high end of their range and much higher than during the last credit crisis. Auto loan delinquencies are approaching their former highs of 2009, despite a supposedly hot U.S. economy. The total amount of credit-card debt is said to be more contained, but it rose to a new record high of $870 billion in the fourth quarter, surpassing the peak registered in the fourth quarter of 2008. In the last quarter of 2018, consumers added $56.1 billion in credit card debt to the total outstanding, 35% more than the post-Great Recession average for a fourth quarter. The increase was the fastest among household credit categories. Credit-card users are obviously back to their old ways; delinquencies will rise fast in the next contraction, as the average consumer’s margin of safety is razor thin. According to USA Today, the average American has less than $4,000 in savings, while the rainy-day fund of 57% of U.S. adults is less than $1,000.

What makes household debt even more precarious now is that the economy is weaker than it was in 2019.

Plus, as we all know, interest rates have risen substantially. So, the implication is clear: the debt bubble appears to be much closer to bursting.

Europe Braces for Serious Economic Slump

European consumers haven’t been very happy.

Indeed, consumer confidence tumbled to its lowest level ever in September, according to the European Commission.

It’s climbed some since then, even so, there’s this Nov. 16 headline (CNBC):

 Euro zone predicted to have a deep recession and a difficult, slow recovery

The chief economist for an investment bank in Germany opined that the Continent’s economy will show deterioration in Q4 2022 and Q1 2023.

Elliott Wave International’s monthly Global Market Perspective has been keeping track of Europe’s economy.  Here’s a chart and commentary from the November issue:

The power of the new bear market is also clearly visible outside of the stock market. In manufacturing, for example, economists tend to view orders minus inventories as a forward-looking gauge of economic performance. The view makes sense, because if orders increase amidst low inventory, manufacturers will need to ramp up production to meet demand. The problem is that manufacturers ride around on the same waves of optimism and pessimism that get reflected first in stock prices, which is why orders-inventories are now deeply negative in the UK, Germany, France, and the eurozone. In fact, the only two weaker readings in the past 20 years occurred when the global financial crisis hit in late 2008, and when the world’s economies closed in early 2020. Here, too, we believe that these low-water marks will be surpassed before the bear market is over.

Big-Time Bankruptcy in the World of Crypto

As you might imagine, an economic depression will bring widespread bankruptcies.

Indeed, in Robert Prechter’s Last Chance to Conquer the Crash, he offered a suggestion for those seeking steady employment when times are tough. Here’s part of what the president of Elliott Wave International said:

There will be a boom in bankruptcy services in a depression; maybe you can keep out of debt by helping others manage theirs.

Well, some of those who already handle bankruptcies have their hands full with a major crash in the crypto world (ABC News, Nov. 11):

What FTX’s bankruptcy filing means for the future of digital currency

Crypto trading platform FTX is filing for bankruptcy and its CEO has resigned.

FTX was valued at $32 billion earlier this year.

The August Elliott Wave Financial Forecast warned about the froth in cryptos and had a section titled “The Exchanges Tell the Story.” Here’s a quote:

In bull markets, financial exchanges are celebrated houses of commerce enjoying popular exaltation. In bear markets, they are necessary evils that need to be curtailed. This very dependable correlation is the reason we’ve tracked a dramatic turn in the valuation of crypto exchanges over the course of the last 15 months. In classic fashion, crypto exchanges bathed in celebrity associations at the final highs. Some attached their names to major sports venues such as the FTX Arena in Miami and the crypto.com Arena in Los Angeles. The share price of each of those exchanges is down significantly in 2022. [In July, we showed] declines of more than 90% in Voyager Digital and Coinbase Global from early 2021 when the Elliott Wave Financial Forecast identified them as candidates for steep falls. These selloffs attest to the potential for further declines in crypto… [emphasis added]

Join the Deflation.com Email Newsletter

Subscribe Now