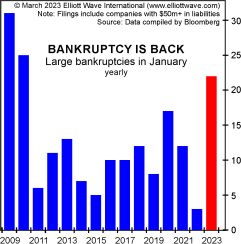
This Bank Warns of a “Default Wave”

Two Deutsche Bank strategists just wrote a study in which they said “a default wave is imminent.”

This May 31 news item from Marketwatch provides details:

By the fourth quarter of 2024, they [the two Deutsche Bank strategists] say the U.S. high-yield default rate will peak at 9%, and the U.S. loan default rate will reach 11.3%. The European speculative-default rate will rise too, though to a less steep 5.8%.

Why? “The tightest Fed and [European Central Bank] policy in 15 years is running into elevated corporate leverage built upon stretched profit margins. This is especially true in the leveraged loan market, where LBO leverage was juiced higher year after year (after year) by zero rates and central bank QE,” they say. LBO means leveraged buyouts, performed by the $5 trillion or so private-equity industry. [emphasis added]

Whether their prediction plays out specifically as described remains to be seen, of course.

The May Elliott Wave Financial Forecast also tackled the subject of defaults. Here’s a chart and commentary:

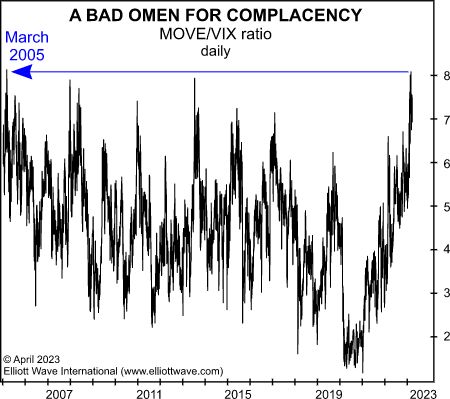
As the Elliott Wave Financial Forecast has said many times, the bond market tends to sniff out impending financial trouble ahead of stocks, and it continues to suggest that the latest default cycle is far from over. This chart illustrates bond market leadership in the form of the MOVE/VIX ratio which surged to 8.07 on April 5, its highest level in 18 years. The prior peak came in the first quarter of 2005. Then as now, it followed an interest rate surge in which yields on the 3-month U.S. Treasury bill jumped from 0.80% in June 2003 to 2.86% in March 2005, a 255% increase. [emphasis added]

German Government Surprised by Recession

Germany has entered a recession. The GDP of Europe’s largest economy unexpectedly slipped 0.3% in Q1 (Daily Mail, May 25):

[Economic] figures come as blow to German government which predicted economic uptick

Germany had doubled its economic growth forecast for 2023 just a few weeks ago from 0.2% to 0.4%.

This economic downturn was not a surprise to Elliott Wave International.

The August 2022 Global Market Perspective showed this chart and said:

A recession in Europe is all but inescapable at this point. … The European Commission remains firmly in denial, saying that the eurozone will escape recession this year, but companies in Germany, which is the Continent’s largest economy, are seeing “softer demand for their products amid a darker economic outlook.” (Bloomberg, 7/4/22) Germany’s GDP also stagnated in July. More importantly, the economy recorded a 0.5% drop in overseas sales while imports were up 2.7%, meaning that the country recorded its first trade deficit since 1991. While deficits themselves are not recessionary, the change in behavior is notable, and, in case you’re wondering, 1991 was indeed a recession year.

U.S. Credit-Card Balances Approach $1 Trillion

Historically, a high percentage of U.S. consumers have paid off their credit-card debt from holiday season spending in the first few months of the year.

That didn’t happen in Q1 2023.

Here’s a May 17 headline from Marketwatch:

Americans are not paying off their credit-card debt. We should be concerned.

Indeed, the credit-card balance of U.S. consumers is $986 billion and the balance didn’t get to that level just because of holiday spending. People are increasingly using their credit cards for everyday necessities.

Consumer debt deflation likely looms as high interest rates makes servicing credit-card debt increasingly difficult.

Debt deflation is usually preceded by an excessive build-up of non-self-liquidating credit.

Robert Prechter compares this with self-liquidating credit in his book, Last Chance to Conquer the Crash:

Self-liquidating credit is a loan that is paid back, with interest, in a moderately short time, from production. Production facilitated by the loan — for a business start-up or expansion, for example — generates the financial return that makes repayment possible. The full transaction adds value to the economy.

Non-self-liquidating credit is a loan that is not tied to production and tends to stay in the system. When financial institutions lend money to consumers for purchases of cars, boats or homes, or for speculations such as purchases of stock certificates and financial derivatives, no production effort is tied to the loan. Interest payments on such loans must come from other sources of income. Contrary to nearly ubiquitous belief, such lending is almost always counter-productive; it adds costs to the economy, not value. If someone needs a cheap car to get to work, then a loan to buy it adds value to the economy; if someone wants a new SUV to consume, then a loan to buy it does not add value to the economy. Advocates claim that such loans “stimulate production,” but they ignore the cost of the required debt service, which burdens production. They also ignore the subtle deterioration in the overall quality of spending choices due to the shift of buying power from people who have demonstrated a superior ability to produce or invest (creditors) to those who have demonstrated primarily a superior ability to consume (debtors).

China’s Factory-Gate Deflation Deepens

The factory-gate price is the price at which factories sell to wholesalers.

Back in October, factory-gate prices in China dropped for the first time since December 2020.

Since then, prices have trended even lower.

Here’s a May 11 news item from Reuters:

China’s slow consumer inflation, deepening factory gate deflation to test policy

The weak consumer price rise reinforces the signals from this week’s trade data suggesting domestic demand remains lacklustre, while the deflationary impulse in producer prices underlines the strains on factories – a double-whammy for the world’s second-biggest economy … .

Our Global Market Perspective has been discussing China’s deflationary impulses for a good while.

Here are brief quotes from three separate issues of the Global Market Perspective during the past several months:

November 2022 GMP: China is out in front of the world-wide economic turmoil, and steel prices are another reflection of its quickening descent. According to Bloomberg, steel rebar is down 33% from its May high. “China’s diminishing steel demand” is cited as the reason for the collapse. Iron ore, the primary raw material in steel, is down an even greater 52% since March.

October 2022 GMP: China’s real estate problem is morphing into a larger economic meltdown. At a time of the year when exports usually surge, China’s export growth slipped from a monthly gain of 18% in July to just 7% in August. On September 9, a Jiangsu-based shipping agent revealed “on condition of anonymity” that “overall shipping demand from customers is plummeting.” Reuters reports, “Alarms are echoing in workshops across eastern and southern China’s manufacturing hubs, in industries from machinery parts and textiles to high-tech home appliances, where businesses are scaling back while export orders dry up.” Shipping costs from China, which we showed last month via the World Container Index, continue to crash, falling another 25% from August to September.

September 2022 GMP: “Chinese economic activity slowed across the board in July,” stated The Wall Street Journal on August 15. “A decline in demand has happened suddenly,” said a Bloomberg article the same day. It quotes a marketing manager of a Chinese textile firm saying orders for buttons, zippers and sewing thread dropped 30% in July and August from a year ago.

The Deflation of European Housing Prices Persists

In Q4 2022, home prices across the European Union slid 1.5% from the prior three-month period.

It appears the decline is not over.

Home prices in some European nations have been hit harder than others. Sweden is a case in point.

Here’s a May 2 Bloomberg headline:

Sweden’s Housing Downturn Deepens, With More Declines Forecast

Elliott Wave International’s Global Market Perspective was ahead of this development. Here are two side-by-side charts from the April issue.

The Elliott wave case continues to point to a generational top in prices. In fact, a full year has passed since we illustrated an ending fifth-of-a-fifth wave up in Sweden’s Residential Property Price Index (left chart). You can barely see it, but that blip on the far-right side of the updated chart represents the sell-off to date. According to the experts, the downturn is pretty much over already. “The National Institute of Economic Research recently adjusted its forecasts to a more shallow dip in house prices, now seeing a drop of between 15% and 20%.” (CNBC, 4/6/23)

Nothing is impossible, but many of the precursors for a broader property bust are still gathering strength.

U.S. GDP Growth Puts on the Brakes

The U.S. economy has yet to enter a much anticipated recession, but it has been slowing.

Here are the specifics from Statista (April 28):

Annualized real GDP growth slowed to 1.1 percent in Q1 2023, the Bureau of Economic Analysis said on [April 27], down from 2.6 percent in Q4 2022 and way below analyst expectations.

However, the article points out a bright spot: the low jobless rate.

Indeed, on Feb. 3, the U.S. Commerce Department noted that the unemployment rate was at a 54-year low of 3.4%.

Yet, that low figure doesn’t tell the whole employment story.

Here’s a chart and commentary from the April Elliott Wave Theorist:

The Labor Force Participation Rate has been dropping for over 70 years. [The chart] shows the history. In 1949, 87% of working-age men worked to support the country; now only 68% of them do.

Not a big change? Wrong. Ratios put the burden on workers into perspective: In 1949, 87% of working-age men supported 13% of them; now 68% support 32% of them. Before, 7 men supported each non-working man; now only 2 men support each non-working man. No wonder employed people are exhausted.

U.S. Commercial Real Estate: “It’s Going to be Ugly”

“The party’s over, unfortunately.”

The CEO of a real estate investment firm just made that comment about the U.S. commercial real estate market.

In an April 19 Yahoo! News article headlined “’It’s going to be ugly’: This CEO just issued a dire warning about US real estate …,” the executive also said “The office market’s going to be destroyed, hotels are going to be destroyed …”

Expect a torrent of defaults ahead.

The April Elliott Wave Financial Forecast provides details and insight into the U.S. commercial real estate market:

The faltering of the commercial real estate market should come as no surprise to [Elliott Wave Financial Forecast] subscribers. In May 2022, EWFF observed that “bellwether [office] markets, such as New York and San Francisco, face gluts.” In October, EWFF tracked the developing weakness across the full breadth of the commercial property market in the form of a completed five-wave rise in the Green Street Commercial Property Price Index (see p.9). Here’s the title we placed on the chart: “The Work-At-Home Bust Begins.” The index is now down 15% since May of last year. In October, EWFF added that it was only the beginning of what should become a “years-long decline.” This potential is acutely apparent in the bellwether markets EWFF cited in May. According to the San Francisco Chronicle, San Francisco’s office vacancy rate is 29.4%, “a record high.” New York’s vacancy rate hit a record high of 18.6% in December. The likelihood of a much deeper decline is symbolized by the public auction of the Flatiron Building; the first public auction of the iconic 5th Avenue structure since 1933, in the aftermath of the Supercycle wave IV bear market. The winning bid of $190 million had to be vacated on March 24 when the high bidder failed to come up with the 10% down payment.

In March and October, EWFF made the case for a “new era of defaults,” which clearly made an appearance in the first quarter of 2023. It started as a trickle in the first two months of the year as a few property developers failed to make payments. Then, on February 24, Brookfield Properties defaulted on $780 million in notes on two LA office properties. Brookfield said at the time, “We are generally seeking relief given the circumstances.” By March 8, the Commercial Observer noted that the “flood” was on, as Brookfield’s action provided “cover for other institutions to do the same:”

A Flood of Defaults Swamps

Big Names, Especially Offices

As EWFF anticipated in October, the Observer traced the change to “workers’ embrace of work from home arrangements. Once viewed as a temporary measure forced by the pandemic, virtual work has outlived the era of social distancing. The dam holding back default filings clearly burst.” With high vacancy rates generating less income to service debt and property prices falling, owners are getting hit by a “double whammy” that “squeezes loan-to-value ratios and hampers owners’ ability to refinance.” Throw in rising rates, and the numbers just don’t add up.

U.S. Bankruptcies: “It’s Different Than Anything I’ve Seen”

Former Home Depot CEO Bob Nardelli is an astute observer of the U.S. economy and in an interview on Fox Business, he discussed the financial pressures faced by many U.S. companies.

Specifically, he noted Bed, Bath and Beyond’s risk of bankruptcy, the closing of Wal-Mart stores as well as layoffs at the retail giant, the closing of distribution centers by Amazon and layoffs at Accenture.

Here’s the April 14 Fox Business headline:

Former Home Depot CEO issues grim warning over US bankruptcies: ‘It’s different than anything I’ve seen’

Nardelli expects a wave of bankruptcies ahead and says “middle market” companies are especially vulnerable.

The March Elliott Wave Financial Forecast commented on bankruptcies as the publication showed this chart:

The chart shows the number of companies with at least $50 million in liabilities filing for bankruptcy in January. The red line marks the latest total of 22, which is already the most since the wake of the Great Recession in 2010.

Layoffs in the U.S. Jump Dramatically

An executive with a well-known company which specializes in outplacement and career transition services says companies are approaching 2023 with caution.

“Caution” is a key characteristic of a deflationary psychology.

In turn, the number of pink slips handed out in the U.S. has substantially risen, especially in the tech sector.

Here are some details (CNBC, April 6):

  • Job cuts have soared to 270,416 so far in 2023, an increase of 396% from the same period a year ago.
  • The damage was especially bad in tech, which has announced 102,391 cuts so far in 2023. That’s a staggering increase of 38,487% from a year ago.

The Elliott Wave Financial Forecast has been on top of this job cuts trend. Here’s a chart and commentary from the February issue:

This chart shows the latest job postings data from Indeed.com, the new No. 1 job site. The percentage change in overall job postings is also crashing. From a peak of 67% in January 2022, postings plunged to -7.5% in November. The Fed’s data do not register Indeed’s latest readings, which show continued declines in postings in January. The plunge is similar to that of 2007, suggesting that the start of an economic contraction is, once again, close by.

Annual U.S. Credit Growth Slows to Single Digits

In the U.S., the credit growth rate has just fallen below its historic average.

Here’s a March 24 news item from Reuters:

Overall annual credit growth rarely turns negative, but when it decelerates into the low single-digits as it has now, it shows that the lending that helps fuel overall economic growth is under strain.

Tightening credit conditions (when banks are reluctant to extend loans to consumers and business) are to be expected when uncertainty reigns, and that’s the case now.

This was foretold in Robert Prechter’s Last Chance to Conquer the Crash, which mentions what happens when overall confidence decreases:

A trend of credit expansion has two components: the general willingness to lend and borrow and the general ability of borrowers to pay interest and principal. These components depend respectively upon (1) the trend of people’s confidence, i.e., whether both creditors and debtors think that debtors will be able to pay, and (2) the trend of production, which makes it either easier or harder in actuality for debtors to pay. So, as long as confidence and production increase, the supply of credit tends to expand. The expansion of credit ends when the desire and the ability to sustain the trend can no longer be maintained. As confidence and production decrease, the supply of credit contracts. [emphasis added]

The psychological aspect of deflation and depression cannot be overstated. When the trend of social mood changes from optimism to pessimism, creditors, debtors, investors, producers and consumers all change their primary orientation from expansion to conservation. As creditors become more conservative, they slow their lending. As debtors and potential debtors become more conservative, they borrow less or not at all. As investors become more conservative, they commit less money to debt investments. As producers become more conservative, they reduce expansion plans. As consumers become more conservative, they save more and spend less. These behaviors reduce the “velocity” of money, i.e., the speed with which it circulates to make purchases, thus putting downside pressure on prices. The psychological change reverses the former trend. [emphasis added]

Join the Deflation.com Email Newsletter

Subscribe Now